Overview of the process
From beginning to end
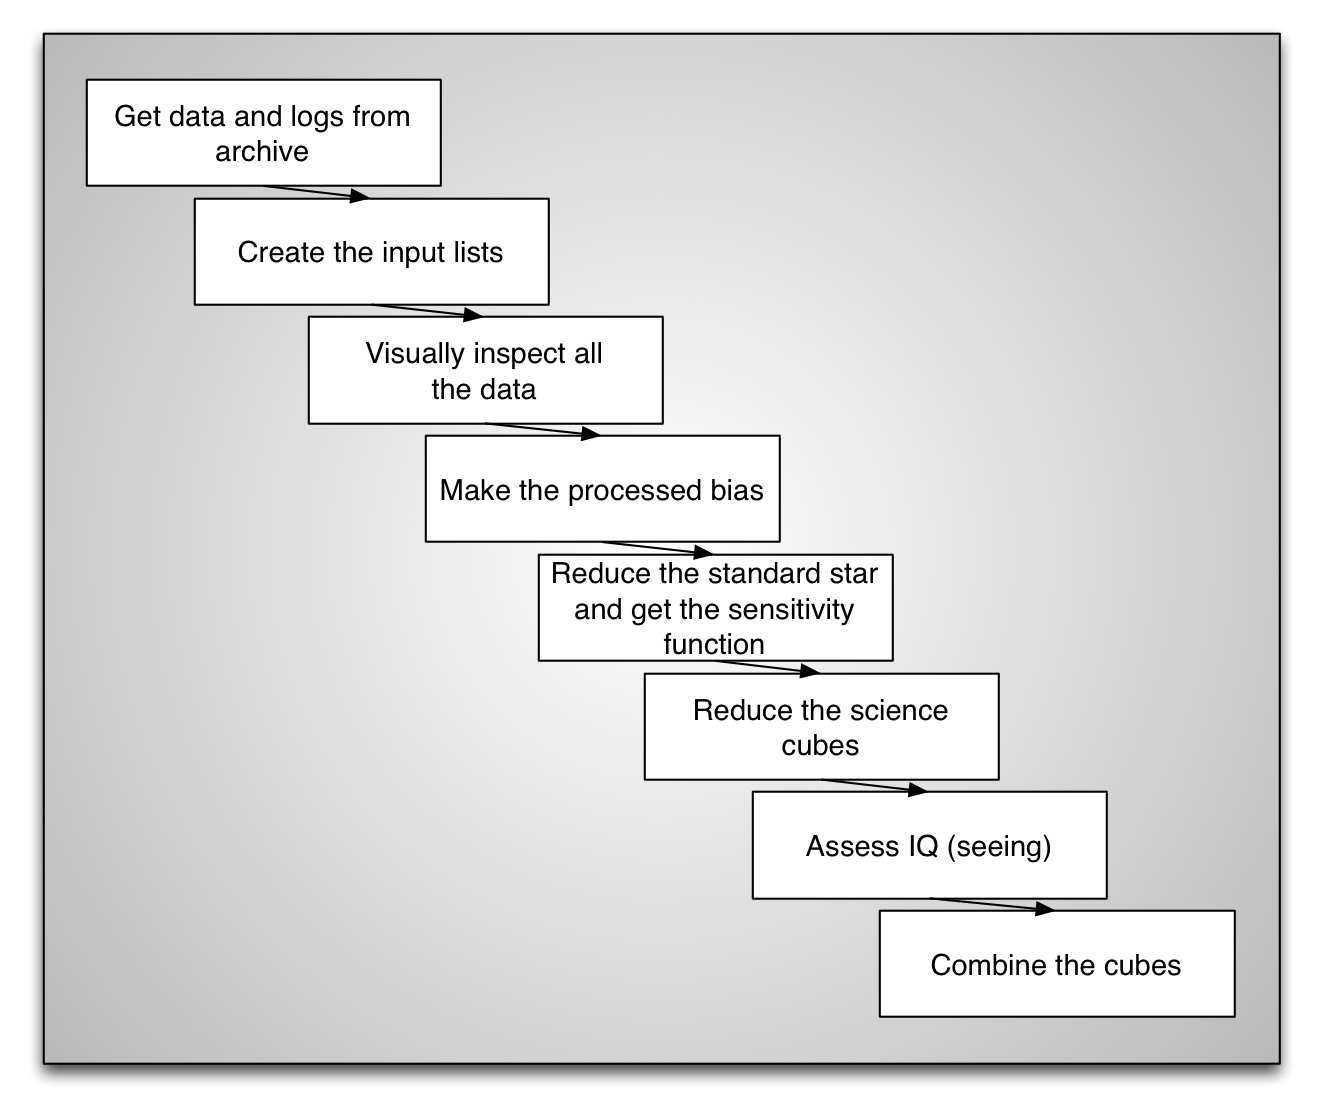
The diagram below is the very top level view of everything that needs to be done, and what we will cover in this tutorial, from getting the data from the archive to combining several cubes together to produce the final product.
Science reduction chart
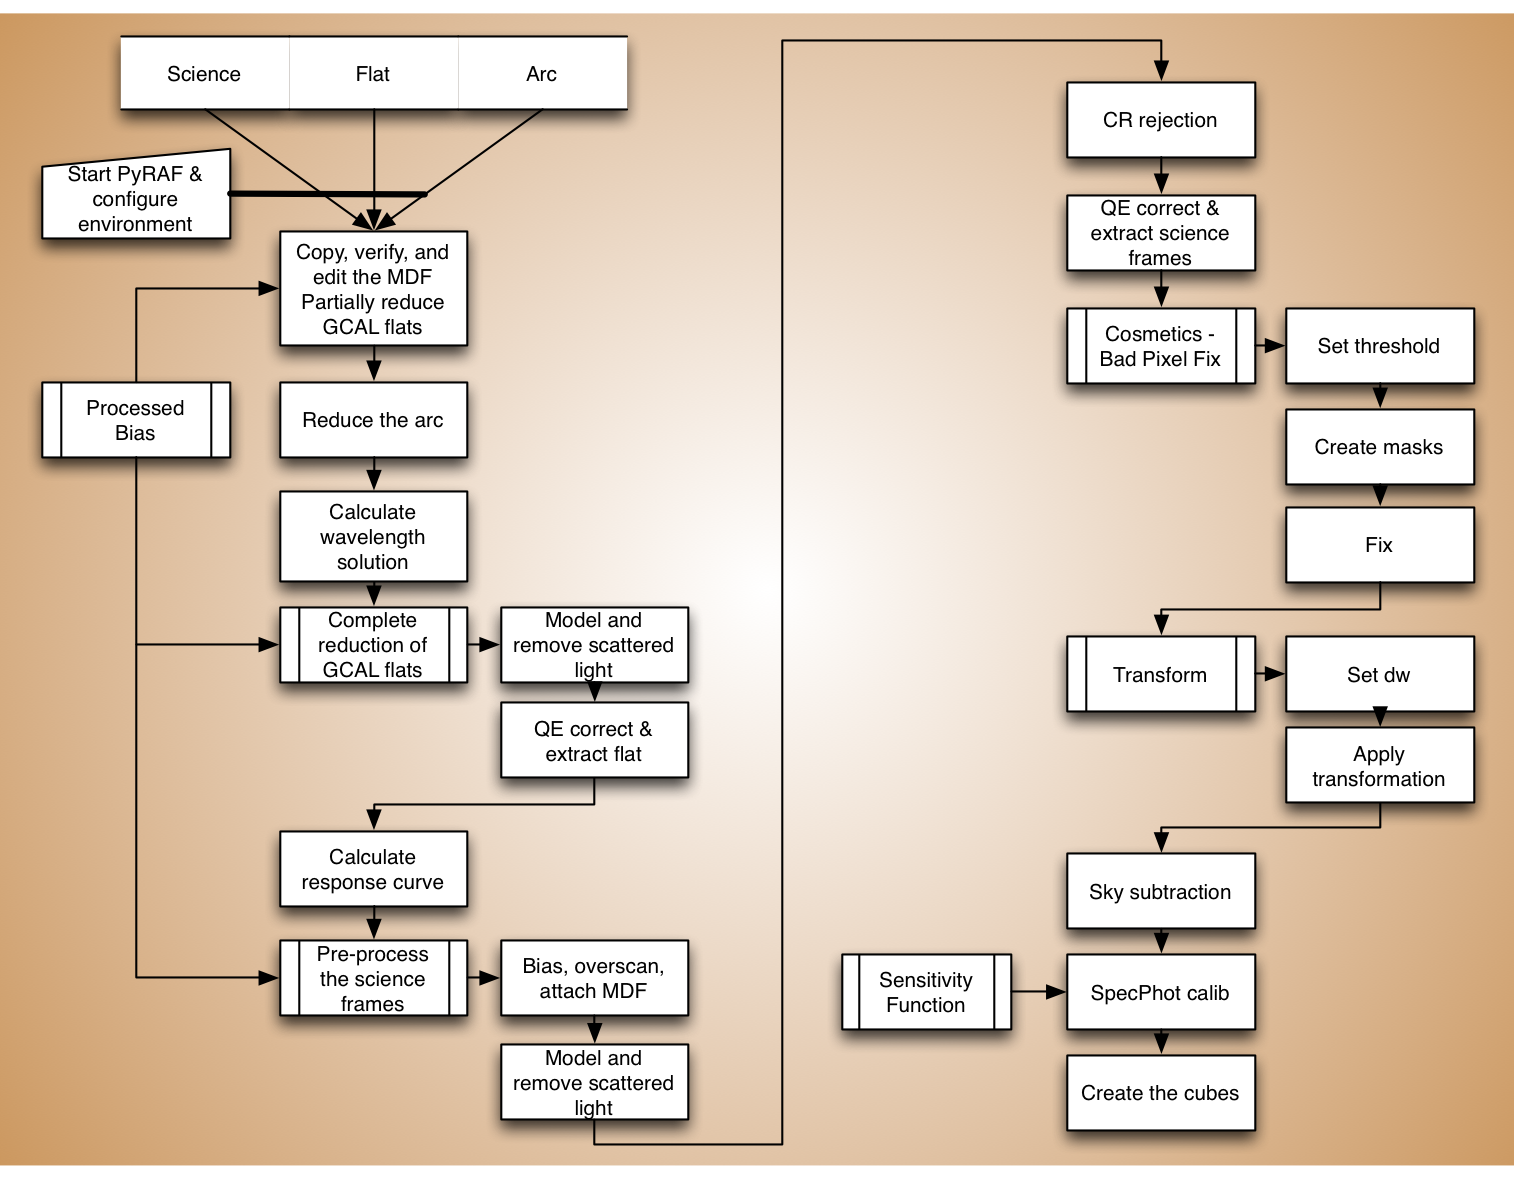
This next diagram explains in more details the steps specific to the reduction of a science exposure, from raw to calibrated cube.
We will keep referring to these charts as we move through this tutorial.